

Back in late 2023, Microsoft announced Python integration in Excel. Like many, I was skeptical at first and continued to rely on VBA and built-in Excel formulas for data analyses and visualization. However, after hearing whispers of its potential on the forums, I finally dove into the world of Python within Excel, and the combination far exceeded my expectations.
The ability to leverage powerful Python libraries directly within my familiar Excel environment has fundamentally changed how I approach data. Looking back, I can’t help but wonder why I didn’t explore this sooner.
Microsoft Excel on Windows supports a core set of Python libraries from Anaconda. You can use a Python import statement to import more libraries through Anaconda.
Related
5 reasons why I use Python instead of Excel for visualizing data
A data visualization upgrade you can’t miss
Cleaning and standardizing customer data

For my e-commerce business, I often receive customer data from multiple sources. With different date formats, varying address styles, and mixed case names, each file has inconsistent formatting. Manually cleaning this data in Excel was a nightmare, time-consuming, and prone to errors. Here is where Python’s Panda library made my job much easier.
First, I need to copy and paste the data from each source into separate sheets in my Excel workbooks and use the Python code to clean date formats and standardize addresses and customer names. Suppose the customer names are in column B of Sheet 3. I can use the code below to get the job done.
=PY(
"""
import pandas as pd
names = pd.DataFrame({'Name': xl('Sheet3!B1:B100')})
names['Name'] = names['Name'].str.title()
names
"""
)
.str.title() converts strings to title case. What used to take hours now takes minutes. The data is clean, consistent, and ready for analysis.
Analyzing sales trends
While Excel offers several functions and tricks to analyze sales trends, Python takes the entire experience to the next level. Whenever I want to visualize the sales trends, identify peak months, and spot any potential dips, I prefer Pandas and Matplotlib libraries to complete the job.
Let’s assume my sales data is in an Excel sheet called ‘SalesData’ with the following details.
- Column A: Month (Jan, Feb, Mar,…)
- Column B: Sales data with numerical values
I can simply run a Python code into an Excel cell. It imports Pandas and Matplotlib libraries, which are essential for data analysis and creating charts. It loads data from the ‘SalesData’ sheet into a Pandas DataFrame, converts sales to numerical data, creates a line chart, calculates and plots the rolling average, and displays the generated chart. It saves time and effort compared to manual methods in Excel.

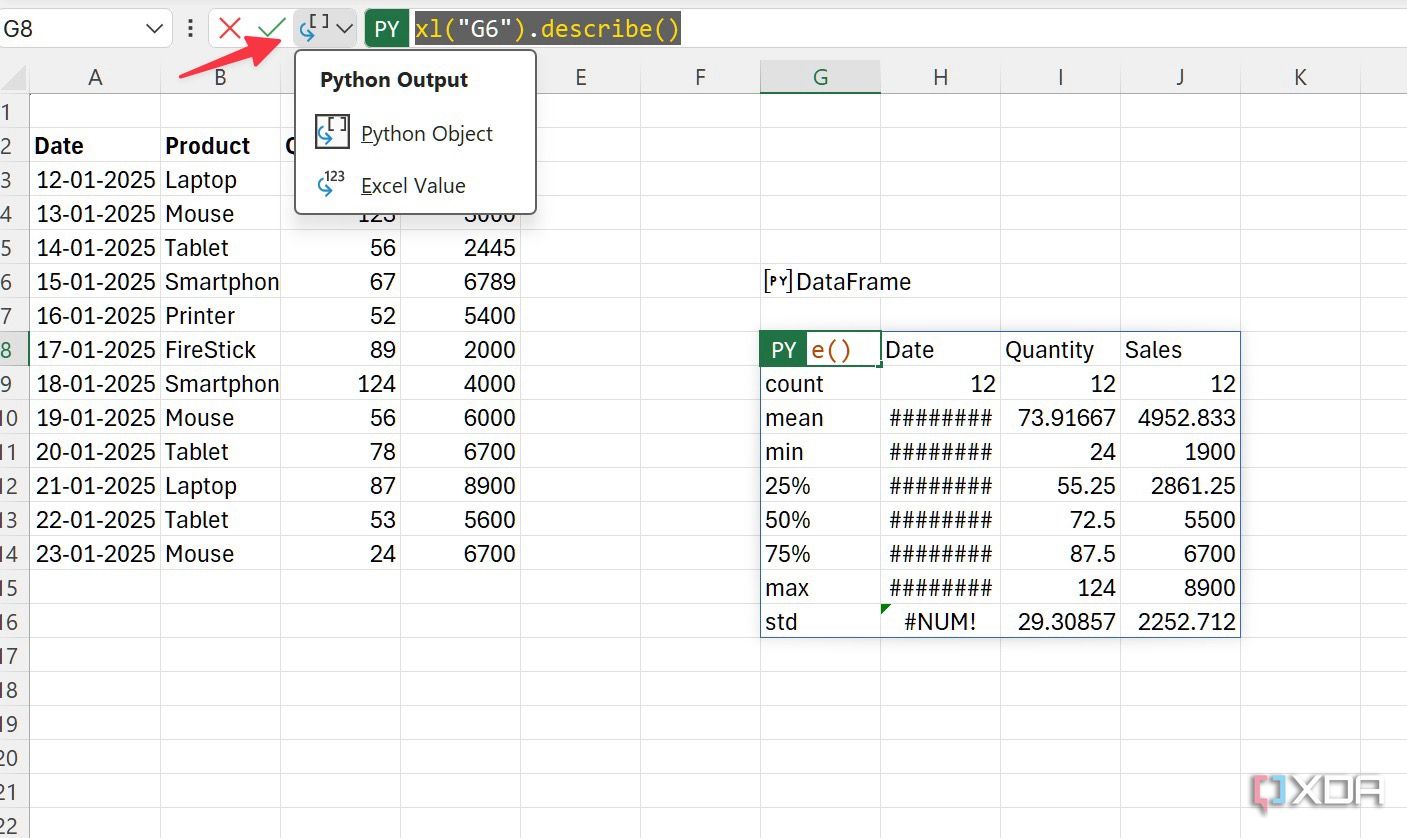
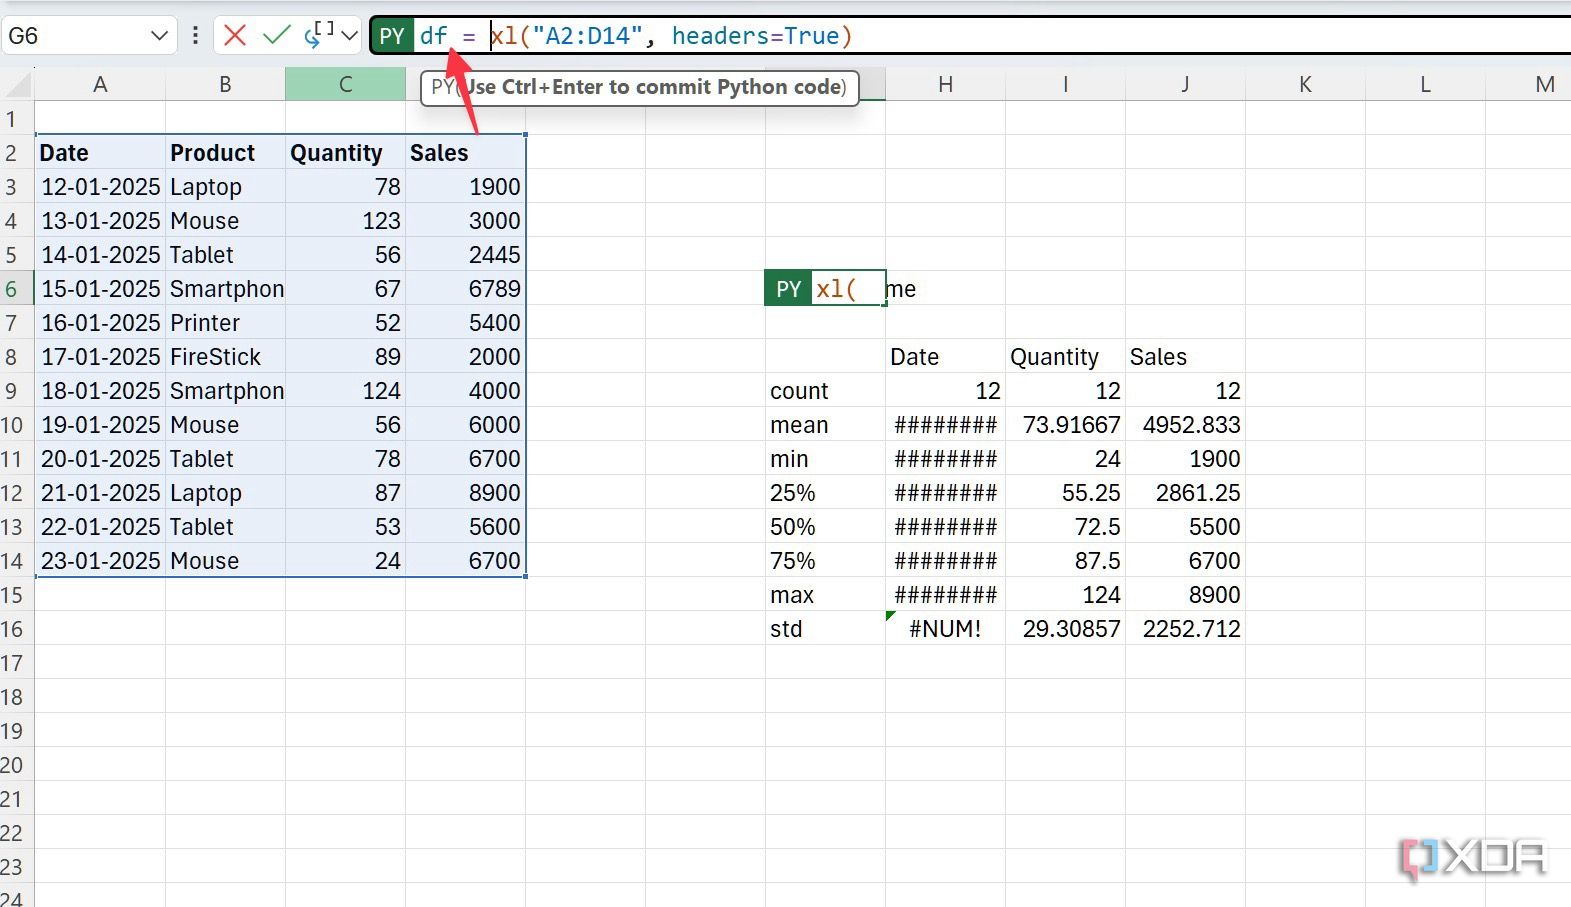
In another example, suppose you have four columns called Date, Product, Quantity, and Sales in Excel. You can select the entire database, use the pandas library to generate DataFrame (basically uploading your data to Python for data analysis), take it as reference, and opt for the describe method to check relevant data. Check the screenshot below for reference.
=PY xl("G6").describe()

I can even go a step ahead and ask it to describe products. I added [“Product”] mention in Python and see the results yourself. I can quickly see the number of products, unique ones, top products, and their frequency.
=PY xl("G6")["Product"].describe()

I haven’t even scratched the surface here. The possibilities are endless here. I can get total sales for each date, generate a chart, and do a lot more with the pandas library. If you are a beginner with Python, you may have a hard time writing code. You may even run into errors. You can take advantage of the Python editor that shows up from the sidebar, learn about errors, and take the required steps.
If you have just started your Python journey, refer to the pandas documentation to learn all the tricks.

Related
VBA vs. Python: Which is the best tool for Excel automation
Understanding the future of Excel automation
Control Python output types in Excel
Excel offers the flexibility to control how Python displays DataFrames. Sometimes you might want to view data in an Excel-friendly format instead of Python.
- Launch your Excel sheet and click on the cell with DataFrame.
- Look for the drop-down menu beside the green PY icon at the top.
-
Choose the output type between Python Object or Excel Value.

Tip: Name your DataFrame
This is another trick I use whenever I explore Python in Excel. I give it a unique name for better reference and code readability. It’s way better than using the full data frame code.
- Select the DataFrame cell in Excel.
-
Give it a unique name right before the formula bar, type =, and press Ctrl + Enter.

Aside from Pandas and Matplotlib, Openpyxl, Squarify, and Pyexcel are some of the popular Python libraries out there. I can’t wait to take them up for a spin in my Excel workflow.
Better late than never
My experience with Python in Excel was a significant revelation. I have gone from navigating complex formulas to effortlessly manipulating and analyzing data with the help of Python libraries. It’s not just about automating tasks, it’s about unlocking a new level of data exploration and insight, right within the familiar interface of rows and columns.
If you are still relying on traditional Excel methods, I highly recommend giving this integration a try. To get started, consider exploring these Python libraries within Excel.
#finally #started #Python #Excel #sooner
source: https://www.xda-developers.com/i-finally-started-using-python-in-excel-and-i-should-have-sooner/

